 Ez Line Chart
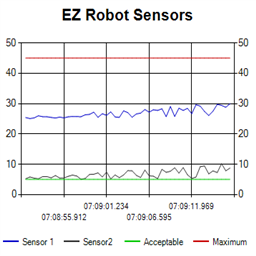
— 4-series historical line chart to log and compare robot sensor values over time with customizable titles, colors, time axis and EZ-Script control
Try it →
Ez Line Chart
— 4-series historical line chart to log and compare robot sensor values over time with customizable titles, colors, time axis and EZ-Script control
Try it →
Read Synthiam articles about robot programming, project ideas, robotics education and AI, along with ARC software and community updates.
Stay up to date with the latest Synthiam product updates, new features, and platform announcements.