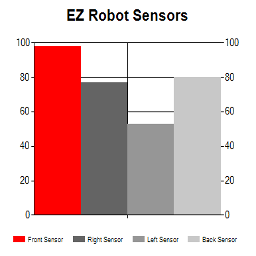
EZ Chart— 4-series bar chart for real-time sensor comparison in ARC; set titles, values, RGB bar colors and conditional coloring via EZ-Script.Try it →
Industry News
Robotics Projects, Software and AI Blog
Read Synthiam articles about robot programming, project ideas, robotics education and AI, along with ARC software and community updates.
Stay up to date with the latest Synthiam product updates, new features, and platform announcements.