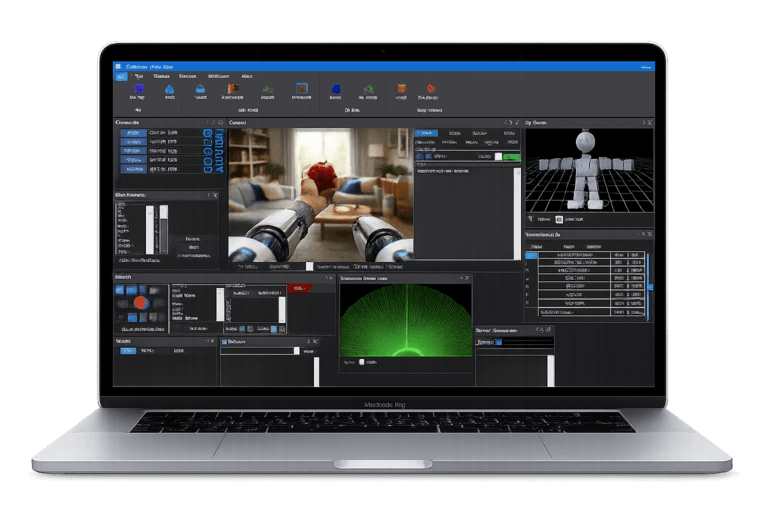
Create authentic learning experiences using our Virtual Reality Robot plugin. Take advantage of our Black Friday offers until November 30th to integrate innovation in your classroom.
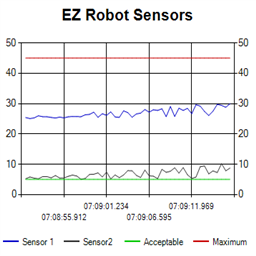 Ez Line Chart
— 4-series historical line chart to log and compare robot sensor values over time with customizable titles, colors, time axis and EZ-Script control
Try it →