





1 Participant

 Download EZB File
In order to use this app, you need Synthiam ARC software.



| For | ARC |
| Author | DJ Sures |
| Created | |
| Last updated |
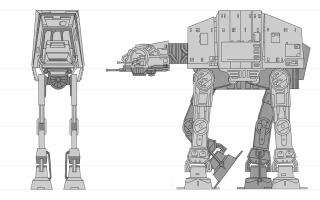
Star Wars Imperial AT-AT Walker. Find out more at https://www.ez-robot.com/Community/Forum/Thread?threadId=8554
Whoops! This page has been moved or is no longer available. Please look around the ez-robot.com website to see if it's been moved. Otherwise, you can always Contact Us if you're looking for something specific.