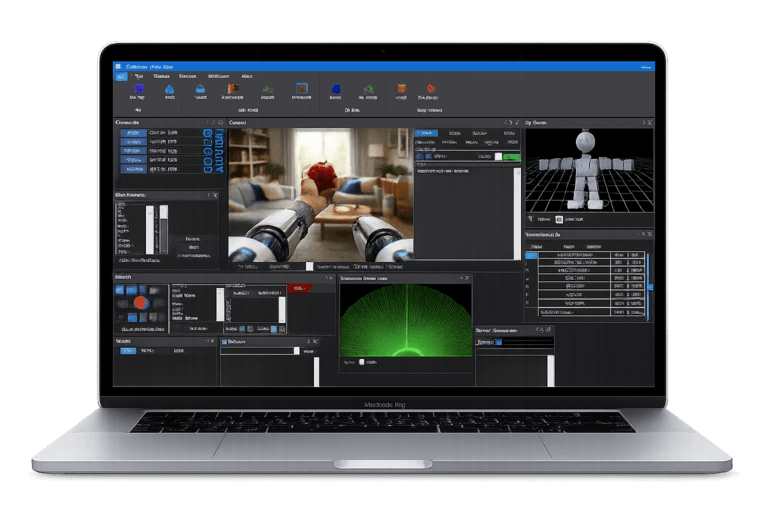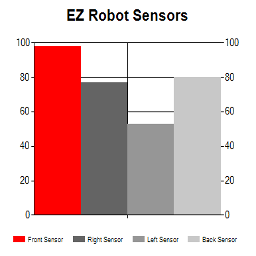
Enable visual tracking. The tracking features would correlate with GPS capabilities to allow better spatial relationships and ability to leverage and communicate geocentric information.
I can be contacted for further discussion on this topic.
Keep making progress guy !
Thanks, Ken McColl
By kenamccoll

Discover more robots
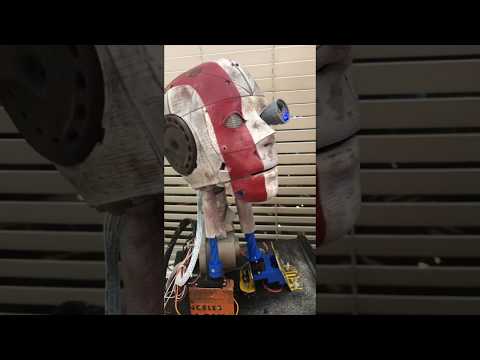
Edbot's RE3D The ROBOT Has Been Watching Too Much...
RE3D tried to audition for a Superbowl commercial but got rejected and now blames me.

DJ's Teddy Ruxpin Robot V1
Teddy Ruxpin robot with EZ-B brain and Synthiam ARC: Bluetooth control, voice synthesis/recognition, servos for mouth,...
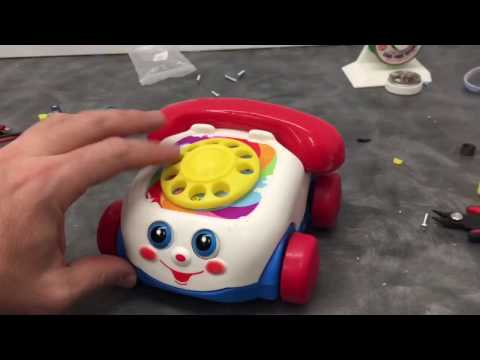
DJ's Fisher Price Chatter
Strangest robot I've ever built, I had to build it. Can you blame me?